Recently, Field to Market: The Alliance for Sustainable Agriculture published its National Indicators Report (NIR). This report, published every five years, analyzes national sustainability trends of commodity crops, including cotton, across five sustainability indicators. This report is key to improving U.S. cotton’s sustainability as it measures continuous improvement, provides insights, and guides targeted research efforts to overcome sustainability challenges.
Overall, the 10-year averages, shown in the spider diagram below, display the improvements made in three of the five key performance indicators (KPIs) as compared to the previous decade. While data for individual years can be affected by severe weather events that cause crop abandonment and yearly variations in KPIs, the overall decade averages show improvements in irrigation water use, energy use, and greenhouse gas emissions. For land use and soil conservation, the longer-term sustainability trendlines are positive, but progress has slowed in more recent decades. During this timeframe, growers have seen challenges due to severe weather events attributed to global climate change and challenges in the adoption of soil conservation practices due to herbicide resistance. Examining ten-year averages instead of individual year over year changes in KPIs is important to normalize the data for weather and other growing conditions and to better reflect on farm practice improvements that result in improved environmental outcomes.
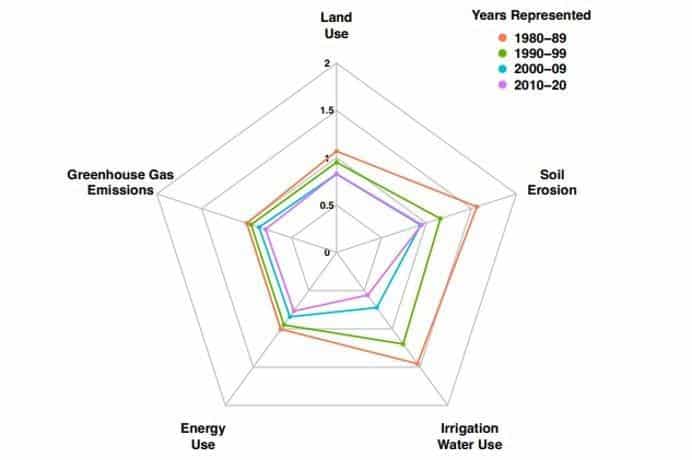 Figure 1.4.1 from the 2021 National Indicator Report. Summary chart of indicators for cotton during 1980-2020
Data are presented in index form, where all indicators have been scaled by indicator averages for the period 1998-2002. A 0.1 point change is equal to a 10 percent difference. Index values allow for comparison of change across indicators with different units of measure. A smaller area represents improvement over time.
For irrigation water use, the report reflects that U.S. growers continue measurable improvements in the 10-year average as compared to the previous decade. This 10-year improvement is part of a larger trend of cotton’s increasing water productivity over the past four decades. Despite the improvements in irrigation water use over the 10-year average, there is significant year over year variation due to droughts and other extreme weather events reducing yields. At Cotton Incorporated, we have a multitude of research efforts focused on improving irrigation water use efficiency. These research projects evaluate alternative water delivery systems such as subsurface drip irrigation and improved irrigation scheduling with soil moisture sensors. One really interesting project is a collaboration with Texas Tech University focusing research efforts to improve water use efficiency by implementing precision water management techniques. The project leverages the latest in unmanned aerial system technologies to remotely monitor and identify soil moisture levels and crop stress conditions for optimal water management and utilization.
Similar to irrigation water use, U.S. cotton also showed strong improvement in the 10-year average as compared to the previous decade for greenhouse gas (GHG) emissions per pound of lint produced. The Global Cotton LCA (Cotton Incorporated, 2017) shows that 60 percent of the overall global warming potential in the agriculture phase of cotton production is related to fertilizer production and use1. Because of this outsized impact on GHG emissions, Cotton Incorporated has launched a coordinated multi-state research initiative, encompassing 16 total research projects (9 focused on nitrogen refinement and 7 focused on improved fertilizer management), to evaluate opportunities for improving fertilizer use efficiency in cotton production. Any improvements made in nitrogen use efficiency can greatly reduce N2O emissions, a potent greenhouse gas, from the field which would continue to lower the climate impacts of cotton production.
The third metric in the National Indicators Report, energy use, is another area where U.S. growers showed improvement in the 10-year average as compared to the previous ten years. Improvements in fertilizer use efficiency not only help reduce GHG emissions, but also have a significant impact on energy use per pound of cotton. As an example, Cotton Incorporated is also collaborating with the Louisiana State University Agricultural Center to evaluate alternative fertilizer delivery methods in an effort to optimize application cost and fertilizer use efficiency. By applying all the nutrients through liquid fertilization in spring or at planting near the root zone may create a major opportunity on further reducing the overall energy use of cotton production.
While the National Indicators report showed that U.S. growers continued to make improvements in the three indicators listed above, we’re continuing to work with experts across the industry to help ensure we meet the U.S. cotton industry’s 2025 sustainability goals. In the other two indicators, land use and soil conservation, the 10-year averages show room for improvement. To deliver on these goals, we will need to further increase our research and outreach efforts to accelerate adoption of best management practices to continuously improve and achieve the 10-year sustainability goals.
In both land use and soil conservation, the 10-year indicators were relatively flat. While U.S. cotton saw considerable improvement from 1980-2020, much of that improvement was concentrated in the earlier part of that time period. This recent flat trend coincides with periods of extreme weather, such as droughts and hurricanes that reduce yields and are increasing in frequency. Looking towards the future, severe weather and climate change will likely continue to be a key challenge for many sustainability indicators. This underscores the importance of helping the cotton crop be more resilient to these adverse weather events through improving soil health. Cotton fields with improved soil health can better utilize rain and irrigation water which helps them stay productive through prolonged periods of drought. Increasing resilience is a key strategy in improving the land use score as well as the other sustainability indicators
Abandoned acres generally occur when there is not enough water available to make a viable crop or a hurricane or other natural disaster destroys the crop prior to harvest. Unfortunately, the abandonment rate from 2015 to 2020 on average went up from 6% to 32%, respectively, as a result of extreme drought conditions and other weather events causing challenging growing conditions (USDA NASS)2. Clearly extreme weather and crop abandonment is a challenge to cotton growers and we have a number of research projects focused on improving crop resilience that will drive both profitability and sustainability.
Cotton Incorporated is working across the Cotton Belt to evaluate the performance of top yielding varieties in each cotton producing region to maximize yield potential and fiber quality characteristics of the crop. These belt wide projects also evaluate planting date to better mitigate risks from environmental factors, the impact on harvest date, yield, and quality.
We’re also collaborating with the University of Arkansas Cooperative Extension Service, as well as the U.S. Cotton Trust Protocol and BCI, at Agricenter International in Memphis, TN on a project that utilizes split field trails to demonstrate how conventional production practices (conventional tillage without the use of cover crops) compared to a management strategy utilizing cover crops and greatly reduced tillage in an effort to improve soil health, soil conservation, and sustainability.
As we continue to evaluate the report, Cotton Incorporated will further explore opportunities to help benefit the cotton industry through research, innovation and an increased focus on measurement. The collection and analysis of data is only half of the equation – we must also be equipped to communicate that data to growers in a meaningful and actionable way.
One method we’ve developed here in the U.S. is by helping to create the U.S. Cotton Trust Protocol, which provides growers additional data to better measure and implement sustainability practices in their operations. Participating growers are able to access this data to provide a baseline against their own operations, as well as utilize insights and best practices across the industry.
At Cotton Incorporated, we also work to publish cutting-edge tools and research as well as decision aids specifically for growers on our grower-focused website, Cotton Cultivated. On this website, growers can access the extensive research library of Cotton Incorporated research, as well as resources from state universities, the USDA and other federal agencies.
We also have the State Support Program (SSP), where Cotton Incorporated partners with researchers at major agricultural universities to focus on the specific needs and challenges of individual states. Each region utilizes a growerled committee that sets priorities, request proposals from their local research institutions and allocates their share of the SSP funds. Once projects have been identified by the committee, they are managed by the Agricultural Research technical staff at Cotton Incorporated.
The Field to Market National Indicators report is an important tool – not just to help measure our progress, but also to provide actionable data to act as a roadmap for the industry. At Cotton Incorporated, we’re looking forward to continuing to analyze the data as well as work to ensure that growers can learn from the data and continue to make improvements in growing cotton more sustainably.
- Cotton Incorporated. (2017). LCA UPDATE OF COTTON FIBER AND FABRIC LIFE CYCLE INVENTORY. ed. Christoph Koffler and Susan Murphy, LCA UPDATE OF COTTON FIBER AND FABRIC LIFE CYCLE INVENTORY. https://cottontoday.cottoninc.com/wp-content/uploads/2019/11/2016-LCA-Full-Report-Update.pdf.
- Citation: United States Department of Agriculture National Agricultural Statistics Service. https://www.nass.usda.gov/Charts_and_Maps/graphics/cotnac.pdf.